D3.js Data Visualization Fundamentals
Data visualizations are the most powerful way to communicate information. D3.js is an open-source JavaScript framework that is changing just how these Data Visu...
Data visualizations are the most powerful way to communicate information. D3.js is an open-source JavaScript framework that is changing just how these Data Visu...
In my latest course, Business Dashboard Fundamentals, I cover step-by-step how to make Excel Dashboards. These Excel Dashboards are just one of the two practica...
Data Warehousing using the Kimball Method For a long time now those of us specializing in the field of Business Intelligence and Data Warehousing have used the ...
Tableau Server has been evolving rapidly over the past few years and one feature I'm most excited about is the Web Authoring capability released in 8.0 and refi...
By keeping all of their products beautifully simple and yet incredibly robust Tableau is quickly becoming the Business Intelligence platform of choice for anyon...
Below is a preview of my course on Big Data Analytics found on Pluralsight.com here: Big Data Analytics with Tableau Not a pluralsight member? Signup for $29/mo...
I'll be presenting on leveraging Big Data with Tableau using Google BigQuery and Amazon Redshift at the next San Diego Tableau User Group meeting on November 7t...
A key part of realizing the value of your hard work building great views in Tableau is sharing and collaborating with others on them. This has historically been...
Excel runs the world. Let me rephrase…Excel RUNS the WORLD. Okay, now that we're in agreement, Google Spreadsheets are the Stephen Baldwin of the spreadsh...
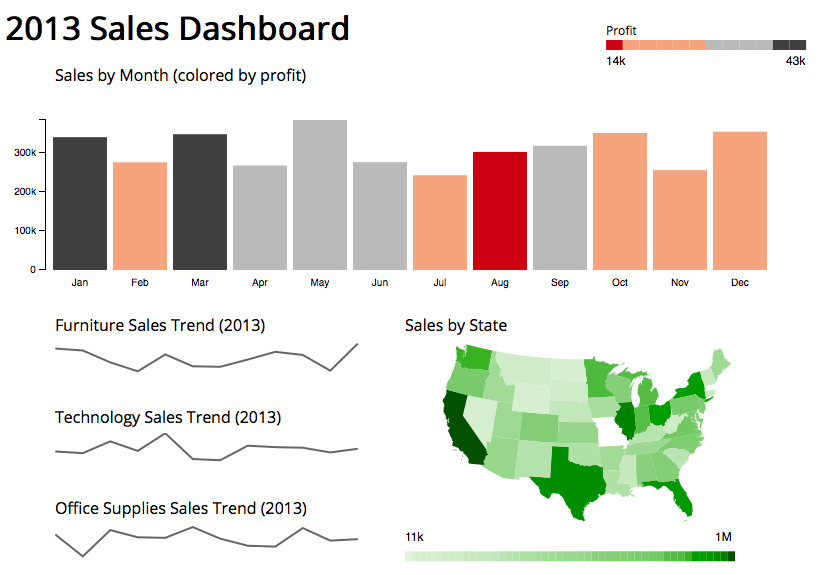
Learn how to truly derive insight from your data using Tableau Software's powerful visual analytics and business intelligence platform. The cleanest most accura...