VizBin : Animated Tableau Dashboards without Coding
Today I'm announcing a new side project I stood up aimed at helping people create more compelling visual stories online. This project, VizBin, is a utility for ...
Today I'm announcing a new side project I stood up aimed at helping people create more compelling visual stories online. This project, VizBin, is a utility for ...
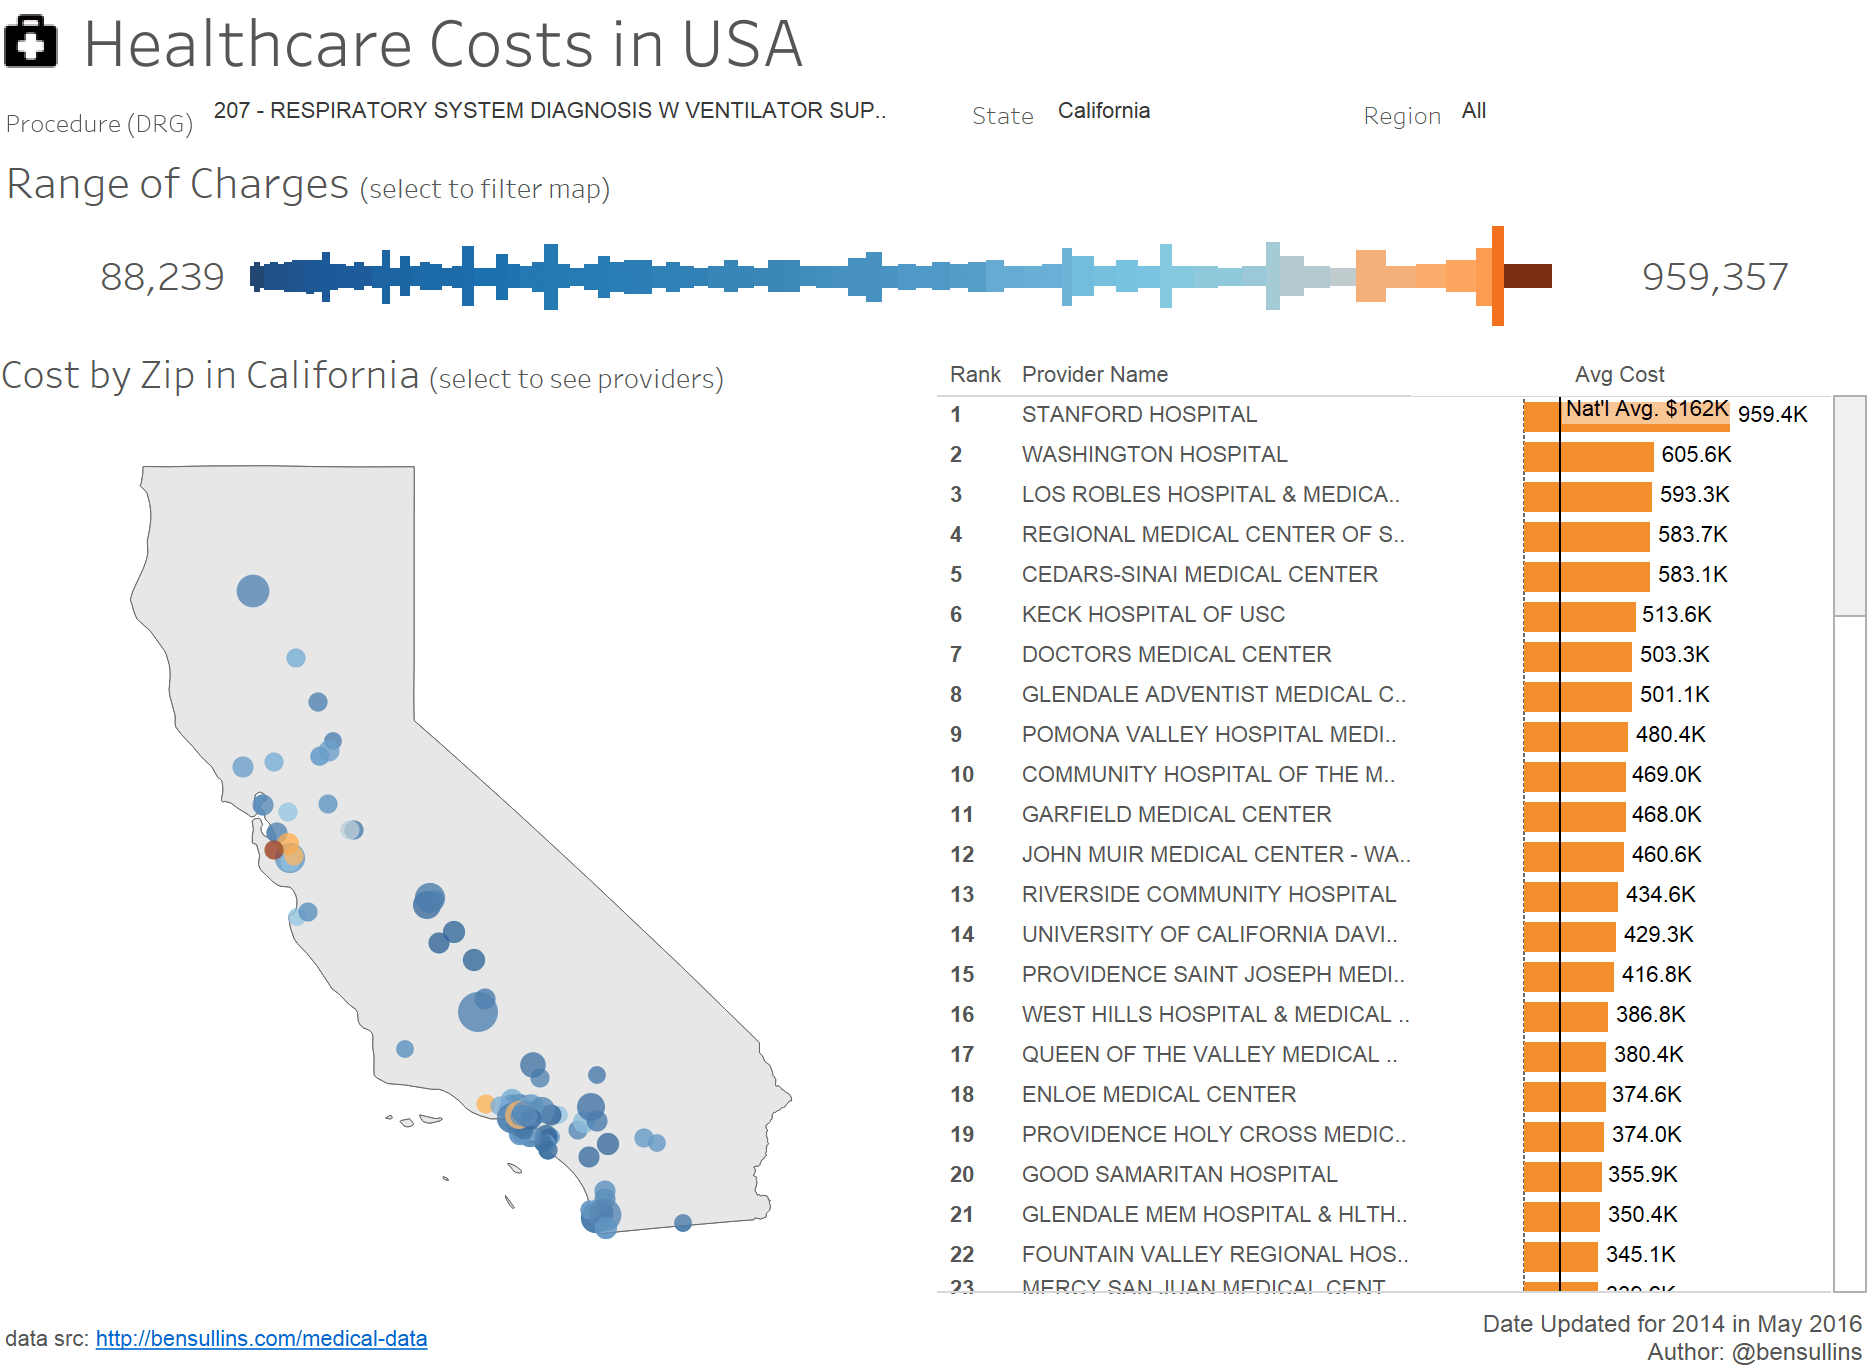
Data updated 2016-09-21 from CMS.govOriginally posted 2013-05-17 The Centers for Medicare and Medicaid Services (cms.gov) released a report detailing Medicare P...

This is another rant from a Millennial that has been working in corporate America since the late 90's. When I grew up there was a belief that you weren't being ...
One lesson I learned a long time ago was that we are all vain when it comes to data viz. Generally, we all care more when a data viz is about us. I've seen this...
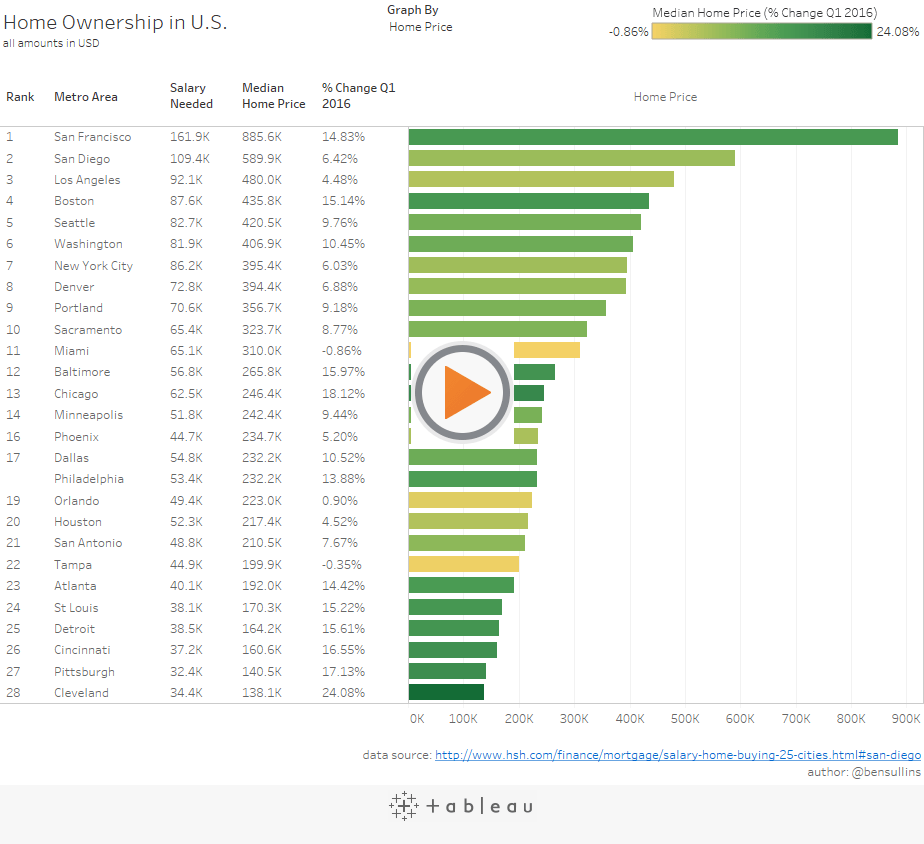
Recently hsh.com published a really good article about The salary you must earn to buy a home in 27 metros which had some interesting data for sure. Looking at ...

Tableau’s software for data analytics has completely dominated the market over the past decade and is now helping more companies than ever see and understand th...
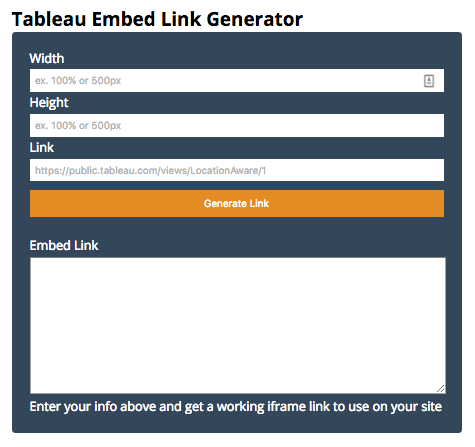
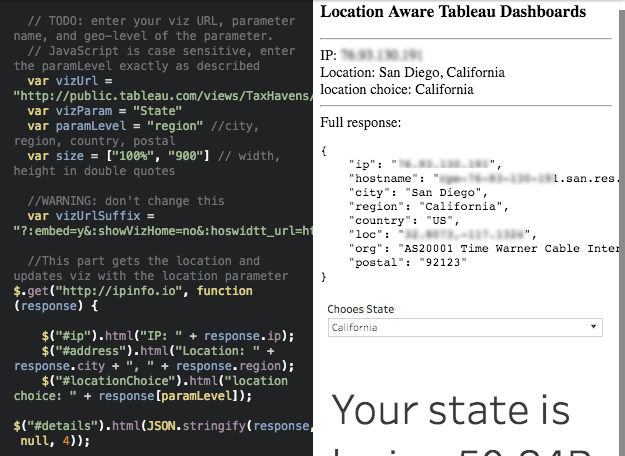
Recently Tableau Public switched their embed codes to use JavaScript instead of an iframe. This is arguably a better solution as iframes are old and stinky and ...
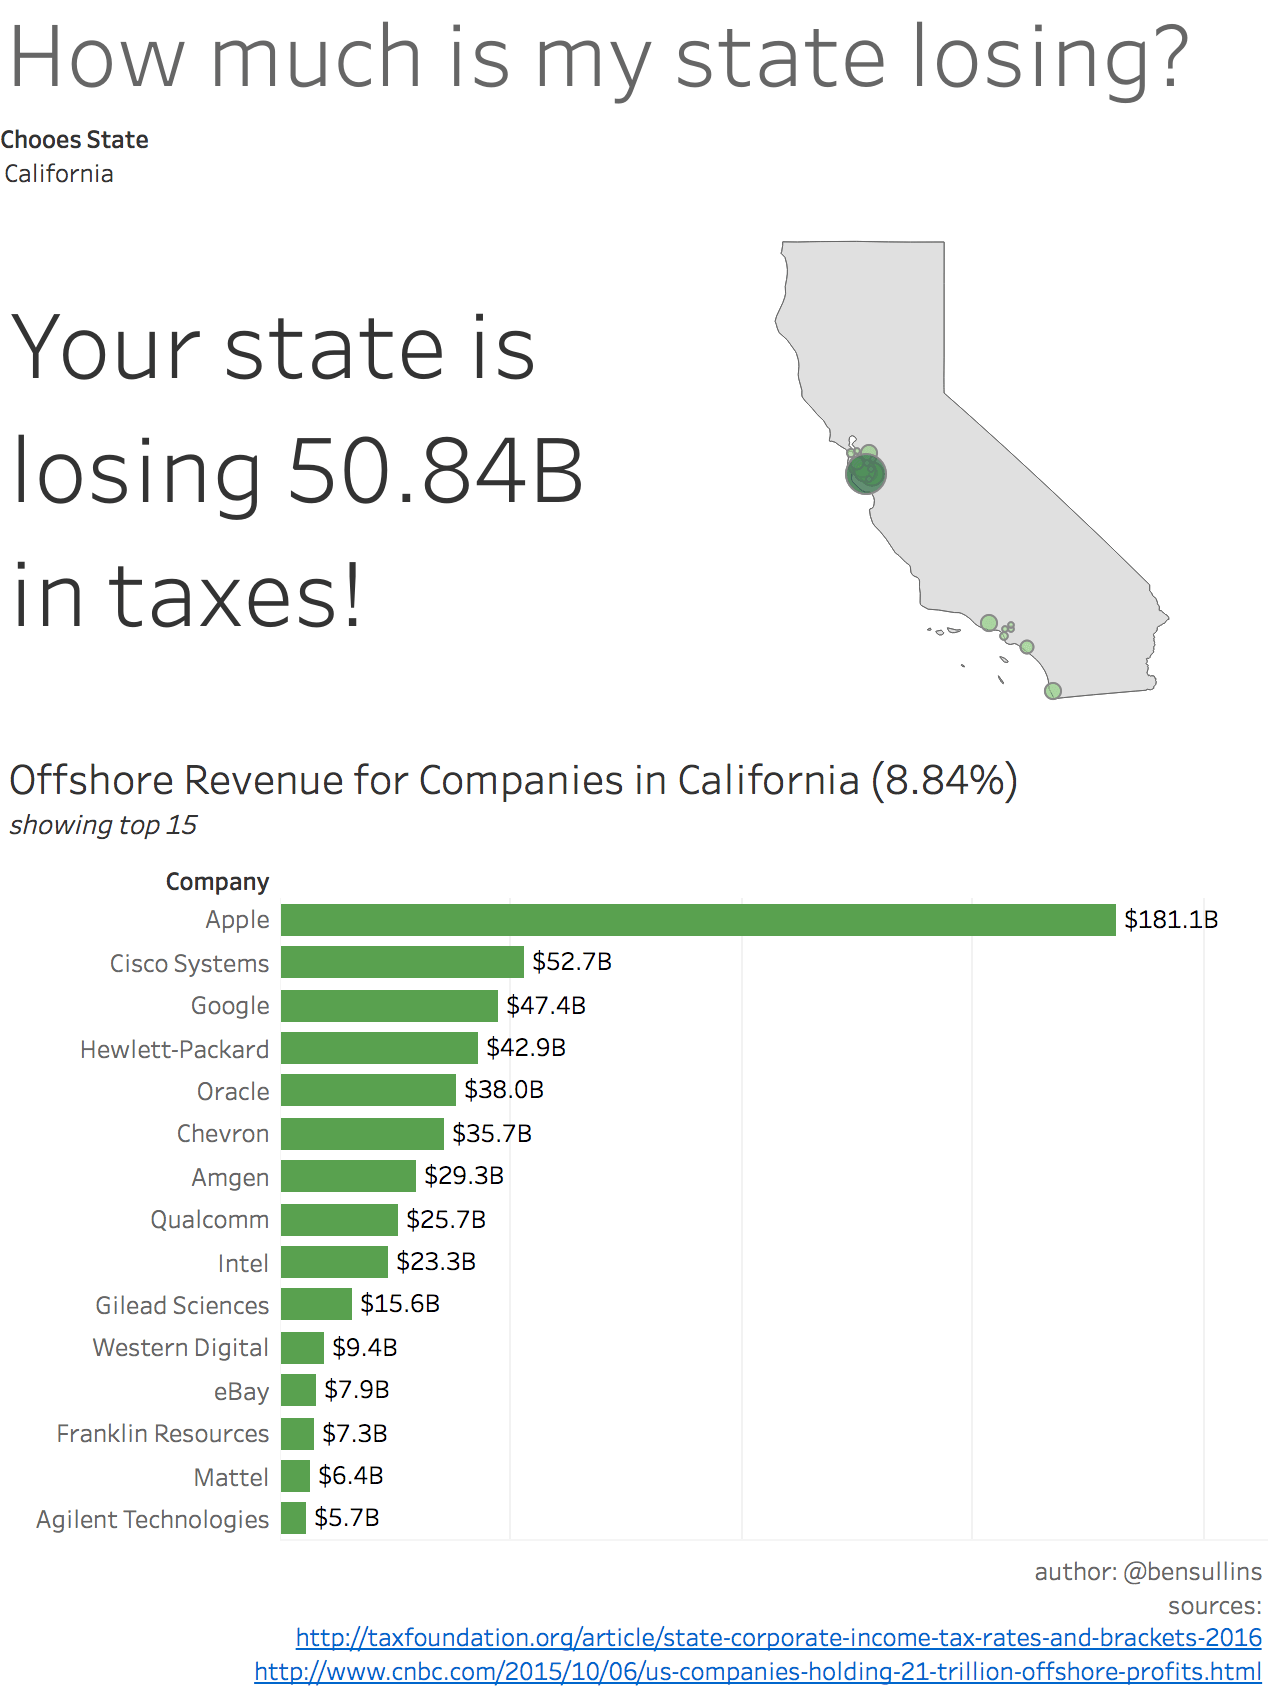
This week I decided to help repurpose some data that wasn't seeing as much love as I felt it could. The data comes from a couple CNBC articles [1][2] that chose...
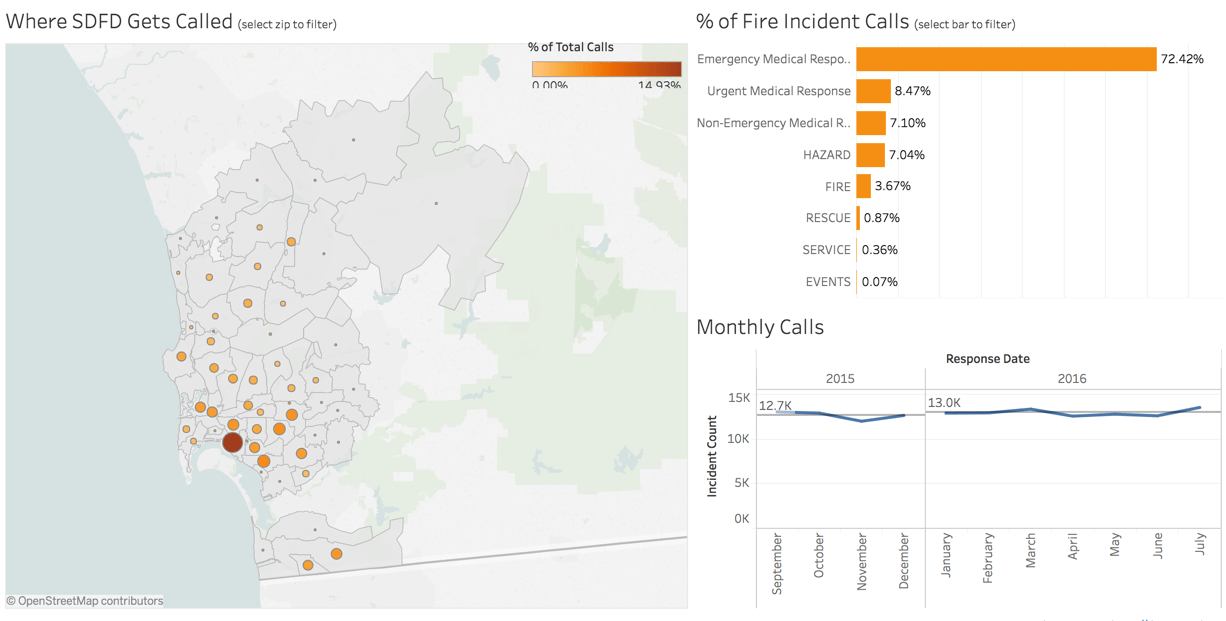
The city of San Diego, my home, recently opened up a lot of their data here: SD Open Data Portal Being the data geek and curious citizen I am I was wondering ab...
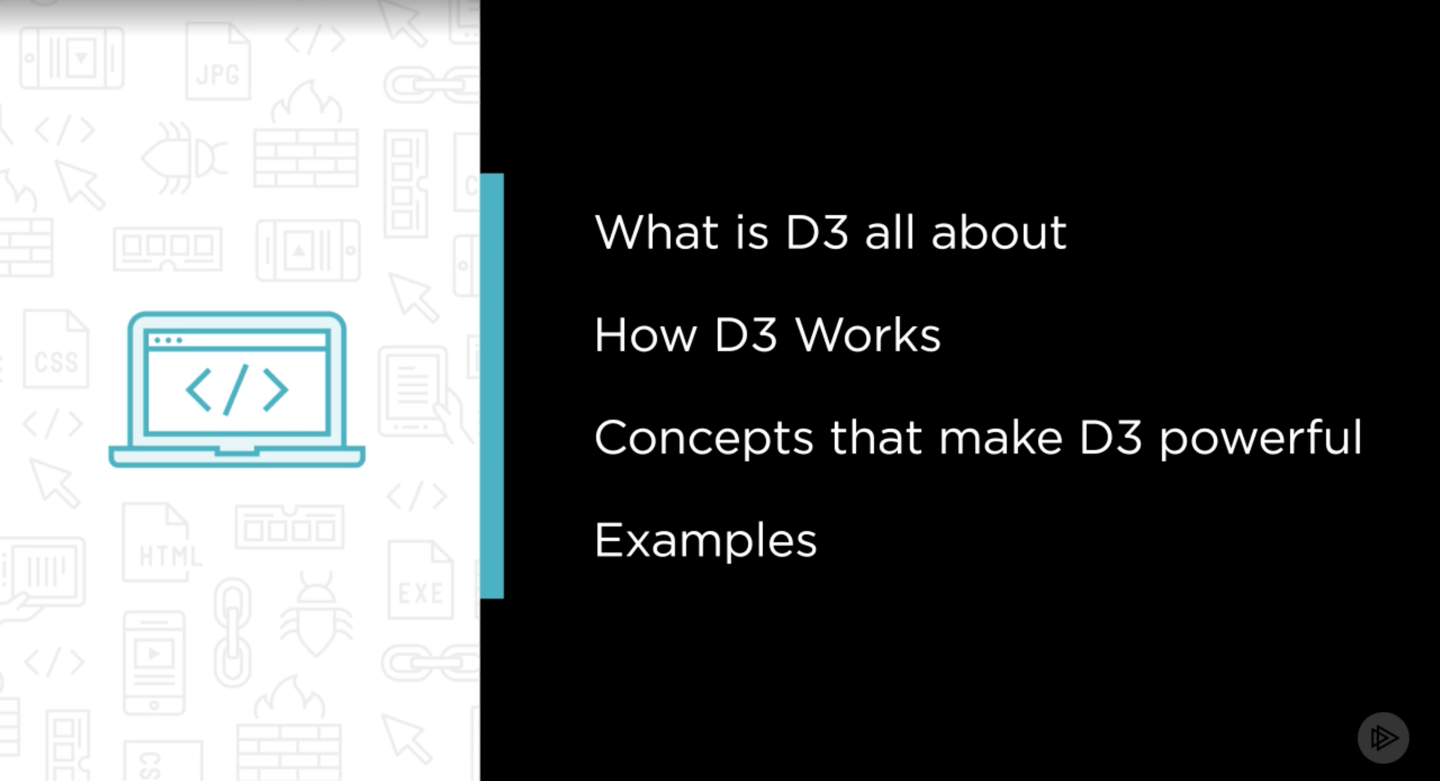
D3 is an incredibly popular way to visualize data on the web, and it's being used by many web apps you use regularly, as well as data journalist and data scient...