Contents
Data Warehousing using the Kimball Method
For a long time now those of us specializing in the field of Business Intelligence and Data Warehousing have used the Kimball Method for everything from modeling our data to capturing user needs. This is the method of Data Warehousing which focuses on modeling business processes into a series of simple tables in a database that provide a human readable version of the data as well as capturing historical context when many line of business applications do not.
This method for Data Warehousing has been great for helping people get answers to questions and make critical business decisions with the power of information behind their thinking. Furthermore, this method is still very valid for many businesses today.
In this series of articles however, I would like to advance the Kimball Method into a new method of Data Warehousing I'm calling the Pulsar Method. Why a Pulsar? Well…one of the key concepts in the Kimball Method is the Star Schema, and this new method I'm proposing can be simplified as collapsing that star. In astrology terms, this is know as a Pulsar “A collapsed star …” [1]
Let's start by understanding what a Star schema looks like:
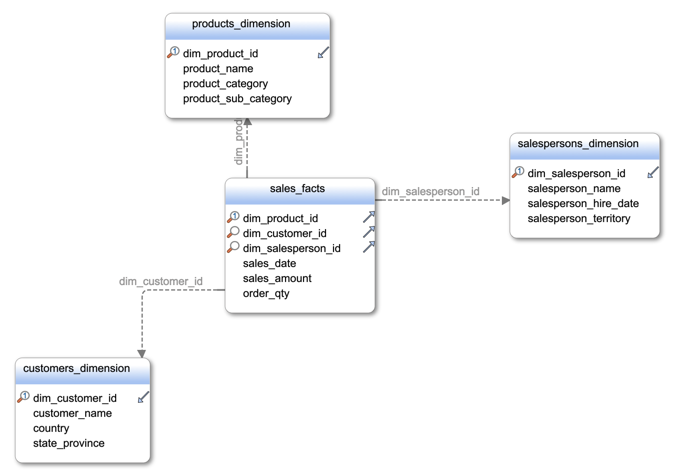
In this example we have a “fact” table which is at the center and with 1 join away we have “dimensional” attributes about the product, customer, and salesperson. This method of modeling data for analysis is far superior to a third normal form (3NF) model that could take up to 10x more joins and perform much slower. With this method we do get some duplication of data still, which is a problem in traditional row-store databases systems such as SQL Server, MySQL, and Oracle.
Data Warehousing using the Pulsar Method
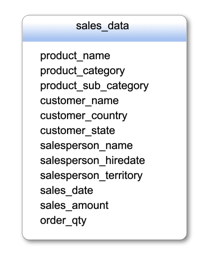
You'll notice that the Pulsar schema contains all of the same fields as the Star however they have been collapsed into a single table. As you might be thinking, this is going to create great duplication of dimensional attributes and greatly increase your data volumes, oh no! Well, have no fear my friends…This is where I would like to introduce one of the Big Data techniques of storing data into a columnar format versus a row format to mitigate this data explosion issue.
If we were to implement a Pulsar schema using a traditional row-based database system like SQL Server, MySQL, Postgres, or Oracle, you might think that querying would be incredibly slow, and you would be correct. So let's take a look at how these new columnar storage engines help us in this case.
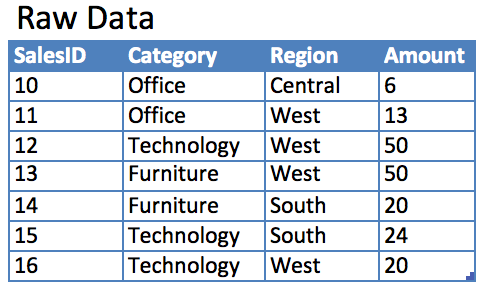
1 – Take a simple data set
2 – Checkout storage methods
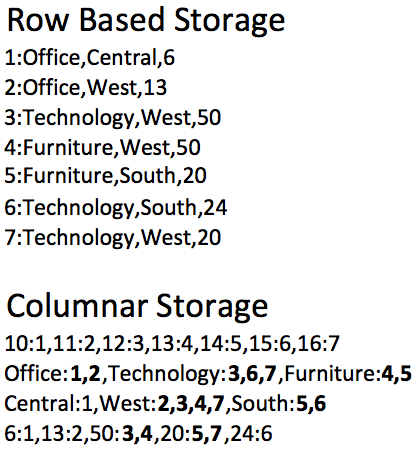
Notice in the row storage we store a pointer to each row and then serialize the column values. In cases like this where we have duplication in a column like category or region we would create an index to make querying faster and reduce this redundancy. In doing so, our data would more resemble the data in the columnar storage engine however the identifier for each column value would still be a pointer to each row. In a columnar storage engine, the identifier itself is the column value, not the row pointer.
The result is in our columnar storage engine we only store 1 row per column “family”. That is, a distinct list of column values inside a column. This allows us to compress the data tremendously by simply storing each column value 1x and then put pointers back to each row to which they belong next to the key value. I've bolded this in the example above to illustrate the compression. Now lets take a look at what some basic queries would be handled by these different storage engines.
3 – Simple Query Examples
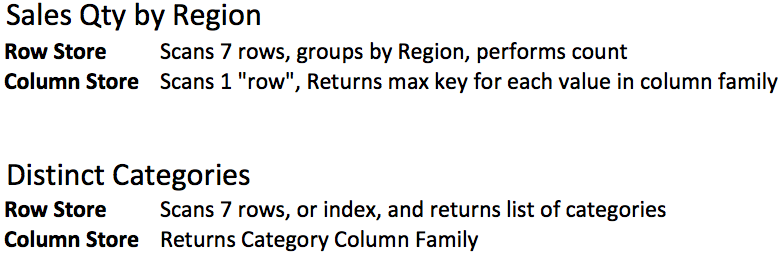
The impact of storing the data this way allows us to no longer worry about our data volumes growing exponentially based on our Pulsar schema in our Data Warehouse. In fact, what we think of as a “table” in many of these systems is really just a logical concept used to allow easy querying.
Hopefully this spurs some thoughts on new ways of approaching Data Warehousing and Business Intelligence within your organization. In the next post of this series we will look at how these Big Data tools and techniques can simplify our data acquisition and storage methods for our Data Warehouse.
Thanks! This is informative.
Very understandable, even for me! I am really enjoying your Big Data Tableau video on Pluralsight. I would recommend you reference/link to this article in your video for viewers to get a better understanding of the differences between architectures.
Thanks Maximus!
Very interesting, I think I’ve been using this method for years without really thinking about it. The last step of my ETL is to tabcmd data extract refreshes of views that represent pre-joined and formatted “pulsars” of my underlying stars. I do it just to reduce complexity so less technical Tableau developers can click and drag without having to know what facts, dimensions, and especially bridge tables are. Once it is in Tableau Server, I end up with exactly what you’re talking about, collapsed stars queried by a columnar database.
Thanks, Jeremy! Tableau extracts are definitely one form of this method that works well. In many places I’ve worked/consulted, we needed a more accessible data source so creating the Pulsar somewhere SQL could be used was our choice.