Data is one of the assets you will misuse the most. The other main assets of your business being your people and your intellectual property. No one starts out thinking how to do data wrong. Data is one of those things however that is easy to screw up, and still feel like you're doing it right. Here are my 3 tips for how to use data wisely to run your business.
Contents
Choosing Metrics That Matter
I want to talk about two main types of metrics. First, Vanity Metrics.
Vanity Metrics
Vanity Metrics are metrics that you use in your blog or in marketing pitches to drum up hype about your business, however, they have little to no value for you when it comes to actually running your business.
Now, we are all guilty of tracking and desiring favorable Vanity Metrics. After all, we are human and these numbers, when positive, give us that dopamine we so desire in our bloodstream.
Here are some classic Vanity Metrics that do not help you at all but feel so good to track:
- Total Sales
- Total Registered Users
- Total Profit
Notice you'll find a common theme here, these are all totals. That is because often at the highest level of aggregation (roll-up) you often lose all the actionable detail below. Now let us take a look at the kind of metric you actually want, Actionable Metrics.
Actionable Metrics
These metrics actually help you understand what is going on with your business and how things are performing. These are the numbers you'll want to review regularly to check in and see how things are going.
That said, you also should think of actionable metrics when it comes to how you evaluate the projects you take on. This is part of a good Data First approach to running your business.
Some example of great Actionable Metrics are :
- Profit Ratio
- Monthly Active Users
- % Change in Sales Year over Year
Notice these are much more nuanced and tell you more about how your business is actually functioning. Let's break a couple of these down in more detail since I think all online businesses should track these metrics.
Profit Ratio
This is the sum of profit divided by the sum of sales. This metric tells you that for every dollar of gross revenue (top line) how much of that do you have left after deducting the cost of providing that service. In an online business, this can be tricky sometimes, but at a high
In an online business, this can be tricky sometimes, but you can calculate it at least at a high level by taking your total income minus your total expenses to get the net income (bottom line) and then dividing the top line number, gross income, by this bottom line number.
Whatever percentage that bottom line is, of the top line, gives you your profit ratio. Investors also call this profit margin, or just margin, or net margin.
This metric is important to pay attention to because it tells you if your sales are healthy. You could, for example, hire a ton of sales people or dump a ton of money in marketing and increase sales. However if you increased them and killed your profit margin at the same time, your business is actually on the decline!
Monthly Active Users
The Monthly Active Users (MAU) metric tells the story of how many of your customers or audience are engaged with your product. You hear these numbers all the time and you probably don't realize it.
When your favorite ginormous tech company reports it's user counts, it is reporting the Monthly Active User count. I should add, Facebook and a few others have switched this to People instead of Users to try and humanize it. For now, don't worry about it, call it whatever you want. For my site, I track Monthly Active Data Geeks 🙂
This number helps you understand how large your audience really is. I don't care if you have a billion users on your email list or that have registered with your website, none of that matters if they're not coming back to engage with you.
So be careful, if you ever hear a company report “Total Registered Users” it is probably because their actual engaged user count isn't anything to write home about.
% Change in Sales Year over Year
Okay, this metric is more of a technique than an actual metric. You can apply a % Change or delta to any vanity metric and it instantly becomes more valuable to you. Looking at Sales alone is rather meaningless, however looking at sales this year compared to last instantly tells you if your top-line is growing.
This is also another great method to apply to metrics like monthly signups or downloads of your podcast, just as one example. For publicly traded companies this is often how market analysts look at a company. All businesses are seasonal, so if Q2 is down from Q1 of the same year but up from the year prior, it is all good 🙂
Causation vs Correlation
This one has to start out with an XKCD comic

So far we've covered the two types of metrics and what they can do, or not do, for your business. Now let's take a quick second to talk about statistics.
Before you nod off wait! This is really important!
Okay, are you with me?
Just because one number appears to be related to another doesn't mean it actually is! That is worth repeating, with bigger words this time…
Two numbers that have a high degree of correlation, may not actually have any direct impact on each others value.
Here is another picture to illustrate this point:
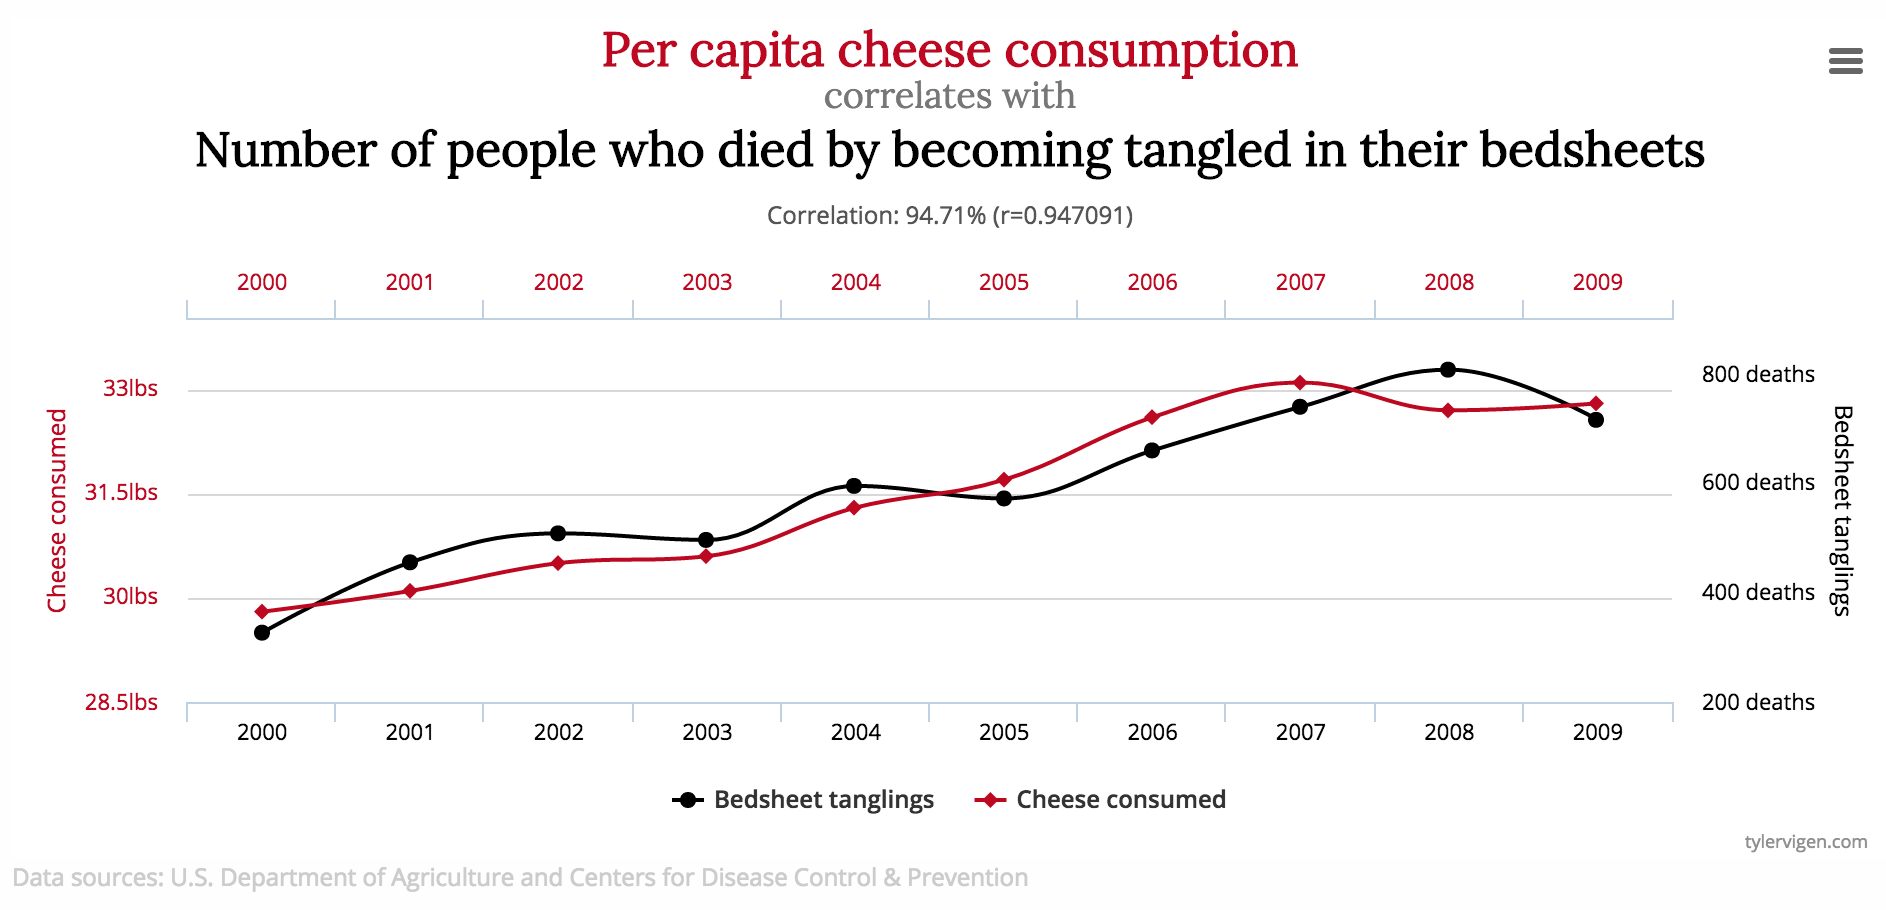
These two metrics are highly correlated (r=0.947) however, they obviously have nothing to do with each other.
When it comes to looking at your numbers, this is key to remember, because when things go bad you're going to want to blame someone or something. We believe data feels no pain (not entirely proven!) so it's easy to look at a metric and find the person sitting closest to it.
BEWARE THOUGH!
Don't get caught in the game of whack-a-mole by trying to chase down one metric in light of another. It's like trying to get fit but only training your biceps. Sorry bro, it won't work, your heart doesn't care how many grocery bags you can carry or how tight your polo is.
Scheduling a Data Review Meeting
With all the best data at your fingertips, it's time to actually schedule some time to take a look at these numbers and take action. Taking action, after all, is the entire point of this. Without this step, all of our data will be entirely useless.
I recommend at a couple different types of meetings to review your data. First off, some data, if you set it up right, you'll want to see daily. When your business is new things like new twitter followers and newsletter signups will give you that dopamine hit you're looking for.
Over time however and as your business grows, you'll want to schedule a more in-depth weekly meeting to dive into the actionable metrics. In that meeting make sure to assign someone to take notes, they'll prove to be invaluable later.
In a future post and probably video blog I hope to go deeper into how to run these meetings for maximum impact.